

Roughly 4 in 5 NYC restaurant inspections over the past year resulted in an A grade, but that number swings by 7 percentage points depending on which borough you’re eating in. Based on the New York City Department of Health and Mental Hygiene’s public inspection records, here’s what the actual numbers show about where the city’s restaurants stand right now.
The citywide numbers: A is the outcome in roughly 4 out of 5 inspections
Looking at every DOHMH inspection with a letter grade recorded between August 2025 and early August 2026, 31,245 inspections resulted in an A, compared to 4,423 B’s and 3,508 C’s — an A rate of just under 80%. That means roughly 1 in 5 inspections during the past year did not result in an A on the first attempt, a meaningfully larger share than the polished “A card in every window” impression most diners walk around with.
For a fuller breakdown of how the underlying A/B/C scoring actually works, see our explainer on NYC’s restaurant letter grading system.
Queens has the lowest A rate of any borough, and it’s not close
Broken out by borough, Manhattan restaurants earned an A in 82.1% of graded inspections over the past year, the highest rate citywide. Staten Island followed closely at 81.3%, then Brooklyn at 80.8% and the Bronx at 79.2%. Queens came in lowest at 75.1% — a full 7-point gap from Manhattan, the largest borough-to-borough spread in the dataset. That gap held up consistently enough across thousands of inspections in each borough that it isn’t just noise from a small sample size.
Two categories of violation account for a huge share of the critical citations
Among violations flagged as “critical” (the more serious tier, carrying more points toward a lower grade) over the past year, improper food storage and contamination protection was the single most common citation, appearing in 6,749 inspections, followed closely by improper cold-holding temperatures for potentially hazardous food at 6,490. Improper sanitizing of food-contact surfaces (6,050) and improper hot-holding temperatures (5,286) rounded out the top four — meaning temperature control and contamination prevention, not exotic or unusual problems, drive the large majority of the serious citations behind a lower grade.
Pest-related violations are real, but less dominant than public perception suggests
Evidence of mice appeared in 4,239 inspections over the past year, and flies or other nuisance pests in 3,153 — both real and significant numbers, but each individually smaller than any of the top four temperature/contamination violations above. Pest sightings tend to generate the most visceral public reaction when a specific restaurant’s violation goes viral, but the data shows temperature control failures are actually the more common root cause of a dropped grade citywide.
Nearly 2,000 inspections cited a missing Food Protection Certificate
2,621 inspections over the past year cited the absence of a Food Protection Certificate held by the manager or supervisor on duty — a compliance and training issue distinct from a physical food-safety failure, but one that still counts meaningfully toward a restaurant’s point total. This is a violation type entirely within an owner’s direct control to prevent through staffing and training, unlike, say, an unexpected pest issue in an old building.
The gap between boroughs likely reflects a mix of building stock and inspection intensity
The Department of Health doesn’t publish a single stated reason for borough-level grade variation, but a combination of factors plausibly contributes: older commercial building stock in some neighborhoods complicating pest control and equipment maintenance, differences in the mix of restaurant types and cuisines (different food-handling profiles carry different violation risk), and possible differences in inspection frequency or scrutiny across districts. Attributing the Queens-Manhattan gap to a single cause would be reading more into the public dataset than it actually supports.
The citywide A rate is up nearly 10 percentage points from the year before
Comparing the same 12-month window one year earlier (August 2024 through August 2025), restaurants earned an A in 69.8% of graded inspections — meaning this year’s 79.75% A rate represents a real, substantial year-over-year improvement of roughly 10 percentage points, not a marginal shift. The prior period’s B and C counts (6,841 and 5,186 respectively) were both notably higher than the current period’s, across a similar total inspection volume. Whether this reflects genuinely improved kitchen compliance citywide, a change in inspection methodology or staffing, or some combination of both isn’t something the public dataset alone can settle — but the size of the shift is real and consistent across the full year of records, not a short-term blip.
American, Chinese, and coffee/tea establishments account for the most inspections
By inspection volume over the past year, American cuisine establishments were inspected most often (13,788 inspections), followed by Chinese restaurants (10,095) and coffee/tea shops (7,401), with pizza (5,511), Latin American (5,009), and Mexican (3,976) rounding out the top six. This ranking reflects the sheer number of establishments in each category citywide more than it reflects relative food-safety risk by cuisine type — a useful reminder that raw inspection counts track restaurant density, not danger level, by category.
This snapshot reflects inspection outcomes, not necessarily every restaurant’s grade today
These figures come from inspection events recorded over the trailing 12 months, not a single live snapshot of every currently-posted grade — a restaurant that scored a B and then earned an A on re-inspection appears in this data as both outcomes, at different points in the year. This is the honest way to describe citywide inspection data of this kind: a real record of what inspectors actually found across tens of thousands of visits, not a claim about the letter grade hanging in any specific window today.
Next step: if you want to check a specific restaurant’s actual current grade and full violation history rather than citywide averages, the Department of Health’s public inspection lookup tool covers every licensed food establishment in the five boroughs by name or address.
Data source: NYC Open Data, DOHMH New York City Restaurant Inspection Results dataset, queried August 2026. New York Daily News accepts guest contributions on NYC food and restaurant topics — see our Food & Restaurants write-for-us page if this is your beat.
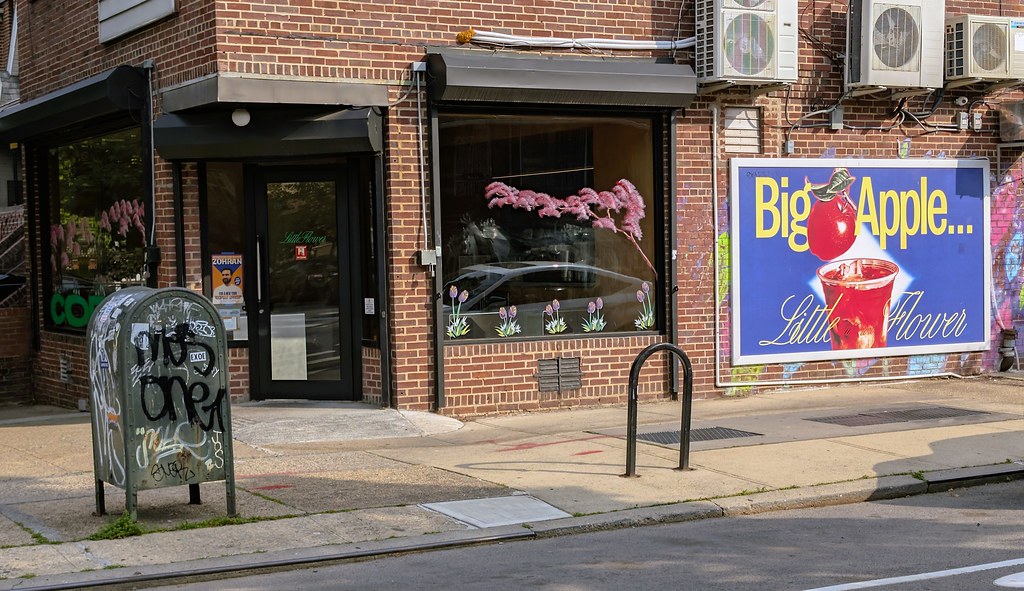
Photo: “Little Flower Cafe, Astoria, Queens” by Newell Reinvention, licensed under CC BY-SA 4.0 (https://creativecommons.org/licenses/by-sa/4.0/).
Related articles: JFK vs. LaGuardia vs. Newark: What Actually Determines Your NYC Airport Transfer Time · NYC’s Electric Vehicle Charging Network Explained · Driving for Uber or Lyft in NYC: What TLC Licensing Actually Requires