

New Yorkers filed roughly 325,000 complaints to 311 over the past 30 days, and the single largest category isn’t rats, noise, or potholes — it’s illegal parking, at just over 46,000 complaints citywide. We pulled the city’s own 311 dataset directly from NYC Open Data to see what New Yorkers actually report, and where. Here’s the breakdown, straight from the numbers.
Illegal parking is the single biggest complaint category, by a wide margin
Of the roughly 325,000 total 311 complaints logged between June 28 and July 28, 2026, 46,089 were for illegal parking — more than the next two categories combined. Illegal parking has real financial consequences for drivers too — see our breakdown of NYC street parking rules that actually cost money. Alternate side parking rules are a big part of why: a car left in the wrong spot on street-cleaning day generates an automatic violation risk, and neighbors report it constantly. Noise complaints came in second and third, split between “Noise – Residential” (30,098) and “Noise – Street/Sidewalk” (26,219) — two categories the city tracks separately, which matters if you’re trying to file the right one.
Water System complaints are the highest-ranked infrastructure issue
Water System complaints — leaks, low pressure, water main issues — logged 17,955 reports in the same 30-day window, ahead of blocked driveways (14,022) and unsanitary conditions (11,890). That puts water infrastructure ahead of street conditions (9,457) and damaged trees (7,521) as the top physical-infrastructure complaint category, which tracks with how much of the city’s water system predates modern materials and maintenance standards.
Brooklyn files the most complaints of any borough, in raw numbers
By borough, Brooklyn logged 98,676 total complaints in the 30-day window, followed by Queens (82,323), the Bronx (71,534), Manhattan (59,083), and Staten Island (13,242). This is raw volume, not a per-resident rate — Brooklyn also has the largest population of any borough, so a higher raw count is partly just a function of more people living there, not necessarily worse conditions block for block.
Illegal parking complaints concentrate in Brooklyn and Queens specifically
Breaking the top complaint category down by borough: Brooklyn (16,992) and Queens (15,375) together account for well over two-thirds of all illegal parking complaints citywide, with the Bronx (7,065), Manhattan (5,372), and Staten Island (1,283) trailing well behind. Manhattan’s relatively low count is notable given its density — likely a reflection of less street parking overall and more enforcement infrastructure already in place, rather than fewer violations happening.
Noise complaints follow a different geographic pattern entirely
Residential noise complaints don’t mirror the parking pattern: Brooklyn still leads (9,334), but the Bronx (7,731) edges out Queens (7,708) for second place, a reversal from the parking numbers. Manhattan again ranks fourth (4,241). The difference suggests parking and noise complaints are driven by genuinely different neighborhood conditions — car density in one case, building density and proximity in the other — rather than one borough simply generating more complaints across the board.
Raw counts don’t tell you which neighborhood has it worst
A higher complaint count can mean a real problem, or it can mean residents in that area are simply more likely to call 311 in the first place — reporting behavior varies by neighborhood for reasons that have nothing to do with the underlying conditions. Comparing raw totals across boroughs of very different sizes and population densities is a starting point, not a conclusion, and any claim that one borough “has it worse” than another needs a per-capita or per-block adjustment this dataset alone doesn’t provide.
Complaint volume reflects reporting behavior, not just underlying problem rates
A neighborhood with a highly organized tenant association or active civic email list often files more 311 complaints per actual issue than a neighborhood with less organized reporting infrastructure — meaning raw complaint volume partly measures how actively a community reports problems, not purely how many problems exist. Comparing two neighborhoods’ 311 numbers without accounting for this reporting-behavior gap risks a real, avoidable misread of which area actually has worse underlying conditions.
This data is public, and anyone can pull the same numbers
Every number in this piece came directly from the city’s own 311 Service Requests dataset on NYC Open Data, which updates continuously and is queryable by anyone without an account or fee. Residents, block associations, and community boards can pull the same complaint-type and borough breakdowns for their own area to see whether a specific issue is trending up or down over time, rather than relying on anecdotal impressions of what’s actually being reported nearby.
Next step: if you want to check your own neighborhood’s complaint pattern, NYC Open Data’s 311 dataset is searchable by ZIP code and date range directly on their site — no special tools required, just a browser.
New York Daily News accepts guest contributions on NYC data, civic issues, and city services — see our New York News write-for-us page if this is your beat.
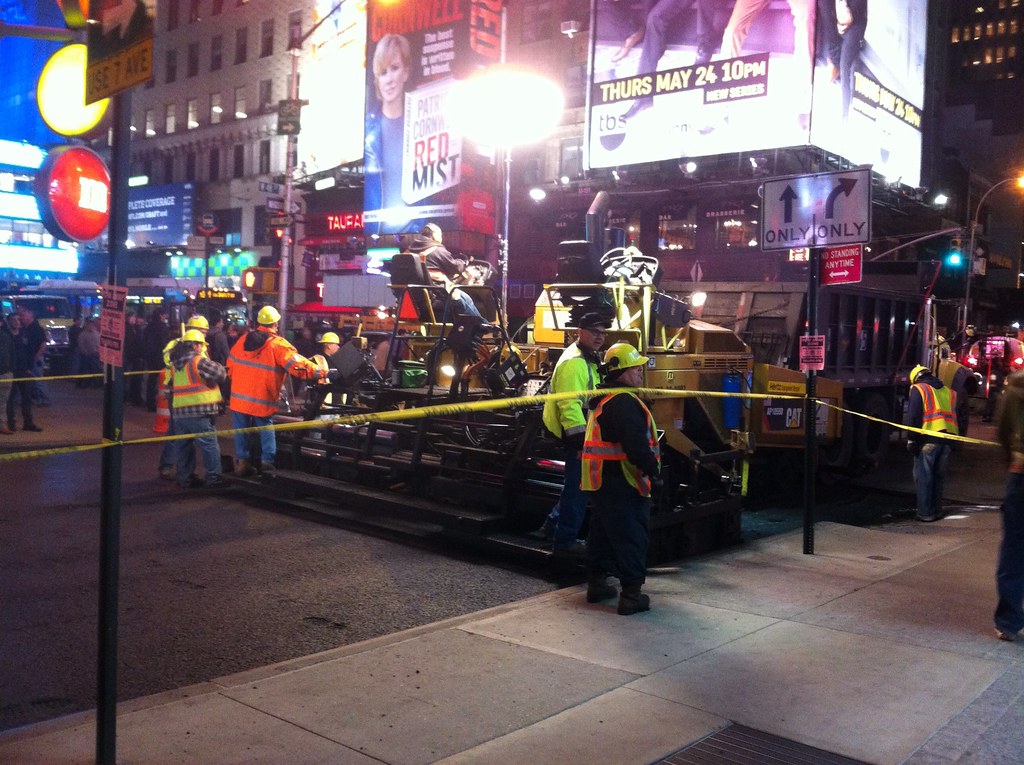
Photo: “New York City Road Repair Crew Photo” by Grant Wickes, licensed under CC BY 2.0 (https://creativecommons.org/licenses/by/2.0/).
Related articles: How NYC’s Rent Guidelines Board Actually Sets Your Rent Increase Each Year · How NYC Specialized High School Admissions (SHSAT) Actually Works · NYC 3-K and Pre-K for All: What Enrollment Actually Requires