

Nearly 19,000 evictions were actually carried out across New York City in the past year, and the Bronx alone accounted for close to a third of them — a far larger share than its population relative to the other boroughs would suggest. Based on NYC’s own public marshal eviction records, here’s what the actual numbers show about where evictions are happening and how the citywide picture is shifting.
The citywide total: just over 19,000 executed evictions in the past year
Between August 2025 and August 2026, city marshals executed 19,023 evictions across the five boroughs, according to the city’s public Marshal Evictions dataset. This figure reflects evictions actually carried out — the final step after the multi-month court process we’ve covered in detail in our breakdown of how eviction proceedings actually work — not the much larger number of eviction cases filed in Housing Court that get resolved, dismissed, or settled before ever reaching this final step.
The Bronx accounts for nearly a third of all evictions citywide
The Bronx recorded 5,887 executed evictions in the past year, more than any other borough by a wide margin — ahead of Queens (4,826), Brooklyn (4,446), Manhattan (3,214), and Staten Island, which recorded just 648. The Bronx’s share, just under 31% of the citywide total, is disproportionate to its share of the city’s overall population, which sits meaningfully lower than that. This gap is consistent with well-documented housing affordability pressure specific to the Bronx relative to the other boroughs.
Residential evictions dominate, but commercial evictions are a real, distinct category
Residential evictions accounted for 17,633 of the total, or roughly 93%, with commercial evictions making up the remaining share at 1,380. While residential eviction data tends to draw more public attention, commercial evictions represent real business closures and job losses that get less consistent tracking in public discussion despite showing up clearly in the same dataset.
The citywide total is up modestly year-over-year, not dramatically
Comparing the same 12-month window one year earlier (August 2024 through August 2025), the city recorded 18,680 executed evictions — meaning this year’s total represents an increase of about 1.8%, a real but modest year-over-year change rather than a dramatic swing in either direction. This is worth noting specifically because eviction trends sometimes get characterized in more dramatic terms than the underlying year-over-year data actually supports.
Several specific Bronx neighborhoods account for a large share of the borough’s total
Looking at the ten individual neighborhoods (by NTA, the city’s neighborhood tabulation area boundaries) with the most executed evictions in the past year, Central Harlem North-Polo Grounds led with 507, followed by East New York (340), Mount Hope (338), East Concourse-Concourse Village (320), Crown Heights North (306), University Heights-Morris Heights (295), Bedford Park-Fordham North (290), Williamsbridge-Olinville (288), and Far Rockaway-Bayswater (260). Five of these nine named neighborhoods are in the Bronx, reinforcing the borough-level pattern at a more granular geographic level rather than the Bronx total being driven by just one or two outlier neighborhoods.
Executed evictions are a lagging, not leading, indicator of housing stress
Because an executed eviction is the end result of a court process that, per our own reporting, typically takes multiple months from initial filing to final marshal execution, this data reflects housing stress that began building considerably earlier — often 6-12 months before the actual eviction date recorded here. A neighborhood’s eviction numbers in a given month reflect economic and housing conditions from considerably earlier, not necessarily current-month pressure.
This data reflects only cases that reached final execution
The Right to Counsel program and the broader Housing Court process we’ve documented mean many filed eviction cases never reach this final marshal-execution stage at all — tenants who receive free legal representation, negotiate a resolution, or catch up on arrears through emergency assistance are removed from the pipeline before an eviction is ever executed. This dataset is a real, honest measure of evictions that actually happened, but it understates the total volume of housing instability and eviction risk citywide, since it doesn’t capture cases resolved short of execution.
Evictions follow a real seasonal pattern, with winter months consistently lower
Broken out by month, executed evictions dropped noticeably during the winter months — November (1,298), December (1,268), January (1,315), and February (1,247) all ran meaningfully below the year’s monthly average — before climbing back up through the spring, with March hitting the year’s highest single-month total at 1,843. This isn’t random monthly noise; it’s a consistent enough pattern across the full 12-month window to reflect a real seasonal rhythm in how eviction cases move through the court and marshal-execution process, not just random case-by-case variation.
Next step: if you’re researching housing conditions in a specific NYC neighborhood, check the city’s public Marshal Evictions dataset directly for that neighborhood’s actual recent numbers rather than relying on borough-wide averages, since the neighborhood-level variation within a single borough is often larger than the difference between boroughs.
Ejectment cases — a distinct legal category from standard eviction proceedings, typically involving property ownership disputes rather than landlord-tenant relationships — accounted for only 20 of the past year’s executions, confirming that the overwhelming majority of the city’s eviction activity runs through standard landlord-tenant proceedings rather than this rarer ownership-dispute category.
Data source: NYC Open Data, Marshal Evictions dataset, queried August 2026. New York Daily News accepts guest contributions on NYC legal topics — see our Legal write-for-us page if this is your beat.
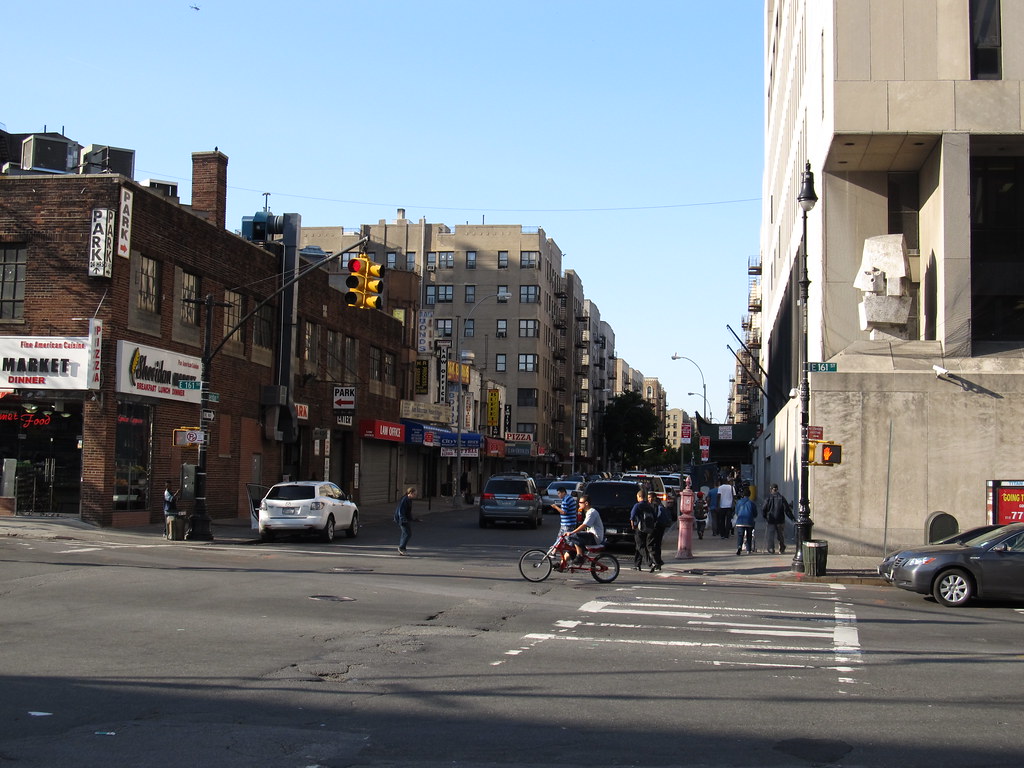
Photo: “Highbridge Neighborhood, South Bronx, New York” by Ken Lund, licensed under CC BY-SA 2.0 (https://creativecommons.org/licenses/by-sa/2.0/).